Self-Service Analytics & BI: No-Code Tools for Non-Technical
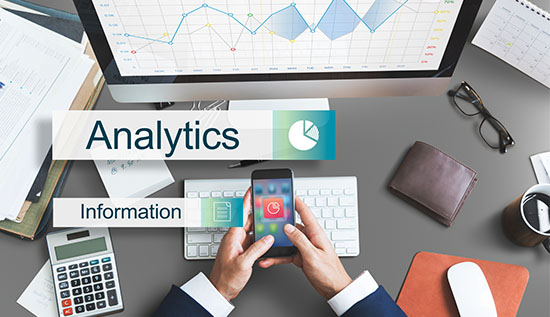
Self-service analytics empowers non-technical users with intuitive dashboards, drag-and-drop BI and smarter decisions.
People and businesses today create a huge amount of information, which includes operational and financial reports, as well as commercial transactions and marketing metrics.
Traditionally, nevertheless, you've needed technical knowledge to turn that data into useful information. It took an extended period for business users to make decisions because they were forced to wait for IT professionals or data scientists to make assessments.
This is where analytics for yourself transforms the landscape. If you’re asking what is self-service analytics, it refers to programs that let people who aren't knowledgeable about technology observe, investigate and present information without having to compose programming.
Instead of relying on technical professionals, employees can take advantage of straightforward user interfaces to find insights through their own research and make recommendations more quickly.
The rise of self-service BI (business intelligence) and no-code BI platforms has made analytics more accessible than ever. With features like drag-and-drop analytics, automated data preparation and customizable self-service dashboards, organizations empower teams to generate reports in real time. These tools are designed as easy analytics software for business users, removing complexity while keeping accuracy of the information.
As demand grows for the best self-service analytics tools 2026, businesses are increasingly adopting low-code analytics solutions to improve agility and performance. Leaders also want practical guidance on how to use analytics without coding while ensuring governance and security.
Knowing the advantages of analytics for yourself for non-technical users is important for companies which want to establish a data-focused mindset and staying competitive in an environment that changes frequently also.
What are Self-Service Analytics & Why It Matters Today
Defining Self-Service Analytics
To fully understand what is self-service analytics, it is important to look at how old-fashioned BI tools worked. Analytics used to be an organized but slow process. The IT or data team would get the relevant datasets, an analyst would make a dashboard and the business user would ask for a report.
The final report might not be given for days or even weeks. Even though this centralized approach made sure that there was control and governance, it often led to bottlenecks that made things less flexible and took longer to make decisions.
In contrast, analytics for yourself shifts control closer to the business user. Employees don't have to wait for technical teams to do things; they can directly access curated data sources, make visualizations right away, edit reports, change dashboards in real time, and look for trends on their own.
This change gives departments the power to quickly adapt to changes in the market. Self-service BI (business intelligence) features that are built into daily processes help more people access data and make operations run more smoothly.
We can't say enough about how important this change is. In industries that change quickly, ideas that come too late can mean missed chances. These days, businesses need to be quick, flexible and accuracy and analytics for yourself provides exactly that by eliminating unnecessary technical dependencies.
Core Components of Modern Analytics for Yourself
Modern platforms are designed with usability at the forefront. Instead of coding interfaces, they provide intuitive drag-and-drop analytics with features that make it easy for users to choose areas, apply filters and make visualizations.
Pre-made templates make it easier to make reports and automatic data preparation cuts down on the amount of cleaning that needs to be done by hand also. Natural language querying is now built into a lot of systems. This lets users type business questions in everyday language and get visual replies right away.
Integrated visualization tools make it easy to make charts and graphs that you can work with and role-based access controls keep private data protected. These features collectively transform analytics into easy analytics software for business users, making it possible for non-technical professionals to analyze data confidently also.
The emergence of no-code BI platforms and low-code analytics solutions further enhances flexibility. These systems are both easy to use and have advanced features that let businesses increase the number of people who use data without making it too hard for users to understand. This makes self-service data available to everyone and ready for use in businesses.
Evidence of Growing Adoption
Many studies, like those from Gartner and Forrester, show that self-directed analytics solutions are growing very quickly. Decentralized decision-making, faster reporting cycles and better collaboration across areas are becoming more and more important to businesses.
Companies implementing easy analytics software for business users often report changes that can be measured. Reporting cycles get shorter, IT workloads go down, cross-functional teamwork gets better and more people in the workforce learn how to use data. These outcomes clearly demonstrate the tangible value of analytics for yourself in modern enterprises.
Example 1: Marketing Team Use Case
Think of a digital marketing team whose job it is to check on the results of campaigns once a week. In the old way of doing things, they would ask for data and wait for help from analytics. But with self-service dashboards, the team can quickly compare ROI across channels, find ads that aren't working and change targeting strategies based on real-time data.
Through drag-and-drop analytics, they generate customized visual reports without technical assistance. By leveraging analytics for yourself, they optimize campaigns mid-cycle instead of reacting after performance declines.
Example 2: Finance Executive Reporting
A CFO managing financial performance across multiple regions also benefits significantly. By using self-service reporting tools for executives, the CFO can keep an eye on trends in cash flow, look at revenue by area and look at changes in expenses on the fly.
The executive doesn't have to wait for analysts to make static reports; they can directly connect with dashboards. With self-service BI (business intelligence) systems and easy-to-use visualization tools, strategic changes can be made right away, making organizations more responsive.
In both cases, reporting from something that needs to be done to something that can be done ahead of time.
Benefits of Self-Service Analytics for Non-Technical Users
The benefits of self-service analytics for non-technical users go above and beyond convenience. It changes the culture of the organization and makes operations run more effectively when it is done appropriately.
- Faster Decision-Making: With analytics for yourself, without having to wait for information technology assistance, business users can answer questions as soon as possible. Quicker choices can be achieved when insights become accessible in immediate fashion: adjustments to an accumulation, transfers of the money in the budgetary framework and estimating revenues.
- Reduced Dependency on IT: IT teams often become bottlenecks when every data request must pass through them. By adopting low-code analytics solutions, companies free up highly qualified employees to spend their time on matters that include infrastructure, management and innovative concepts.
- Increased Data Literacy: When employees regularly interact with self-service BI (business intelligence) instruments by which they acquire more proficient in analyzing situations. This makes an environment that is influenced by data over an extended period.
- Enhanced Executive Visibility: Executives rely on accurate, timely data. Self-service reporting tools for executive’s leaders are delving deeper into metrics for achievement, change KPIs to accommodate their particular requirements, and exchange observations between departments.
- Cost Efficiency: Investing in no-code BI platforms often cuts down on the market value of independent consulting, the work the fact that needs through reporting by other means, and waste from operations.
Step-by-Step Guide: How to Use Analytics Without Coding
If you’re new and wondering how to use analytics without coding, simply do the following procedures:
- Link up sources of information: Bring in information collected from a CRM, ERP, marketing system or Excel spreadsheet.
- Clean up and get prepared information: Implement tools that process documents automatically.
- Choose a template for visualization: You can use tables, data visualizations, or infographics.
- Use categories: Separate up by time frame, assignment or neighborhood.
- Publish & Share: Create self-service dashboards accessible to stakeholders.
This simple workflow illustrates how self-service analytics keeps the mathematical rigor while getting rid of the unnecessary complication.
Best Self-Service Analytics Tools 2026 & Implementation Strategy
Selecting the best self-service analytics tools 2026 must carefully think about how to make it usable, scalable, governed and able to integrate with other systems. Businesses can't just choose a platform because it's a well-known brand; it has to meet their goals, be easy for non-technical users to use and work reliably for both small teams and the whole company also.
The purpose of adopting analytics for yourself is to empower employees across departments to explore data, create insights and make informed decisions without relying solely on IT teams or specialized analysts.
In the business intelligence area, there are a few top vendors that always stand out. Microsoft Power BI is famous for its powerful visualization tools, adaptable data models and easy integration with other Microsoft products. Tableau provides powerful drag-and-drop analytics that let users build interactive dashboards and perform advanced analyses without coding.
Associative data modeling in Qlik lets users look at how datasets are related on the fly, and Looker offers cloud-native analytics with powerful tools for oversight and reporting. These platforms are all great examples of self-service BI (business intelligence) tools that are both easy to use and have a lot of advanced features.
When evaluating no-code BI platforms, some of the important things that companies ought to maintain in mind involve the following:
- Ease of Use: The tool should be easy for business users to understand so they can easily move around dashboards and make reports.
- Integration: It needs to be able to easily connect to many different types of data sources, such as spreadsheets, CRM systems, ERP platforms and cloud databases.
- Governance and security: The platform should make sure that data is correct, consistent and follows the rules, even if users can access it on their own.
- Features for working together: It should be simple for teams to share dashboards, leave comments on reports, and align their thoughts.
- Mobile Accessibility: Executives and managers should be able to use their phones to get real-time information also.
- AI-Assisted Insights: Automated pattern recognition and trend analysis can help users find insights that they can use more quickly.
Implementing analytics for yourself successfully requires a structured approach. Organizations should first define business objectives and key performance indicators. Clear goals ensure that even low-code analytics solutions deliver measurable value.
Establishing robust data governance protocols ensures the accuracy and reliability of insights. Providing training is crucial so employees understand how to use analytics without coding and how to properly understand facts.
By testing the platform in a single area first the company can make workflows better before rolling it out to the whole company. Monitoring measures for dashboard adoption and usage helps make sure that engagement lasts and has a long-lasting effect.
The practical value of analytics for yourself can be seen in multiple real-world examples. In retail operations, a company implemented easy analytics software for business users to monitor store performance, inventory turnover and customer traffic.
Regional managers created customized self-service dashboards for local metrics, they can now compare trends across sites and figure out the best way to distribute their inventory in real time. This method got rid of the delays that came with centralized information and let managers react quickly to changes in the market.
Similarly, human resources teams have leveraged low-code analytics solutions to track workforce metrics such as attrition rates, hiring pipeline performance and diversity statistics.
Using self-service reporting tools for executives, HR leaders could make real-time reports without having to rely on analysts, which let them make quick changes to their workforce plans. This not only helped people make better decisions, but it also encouraged everyone in the company to use data to make decisions.
Choosing the best self-service analytics tools 2026 isn't just a technical choice; it's a strategic one. Analytics for yourself can help companies make data more accessible, speed up decision-making and create a culture of analytical empowerment when used with structured implementation, governance and training.
By leveraging no-code BI platforms, intuitive drag-and-drop analytics and enterprise-ready reporting features, organizations can transform analytics from a specialized function into a core driver of growth and operational efficiency.
Conclusion
The rise of analytics for yourself marks a changing point in how businesses use technology. Analytics competencies are increasingly not just for technical employees; they can also be used by marketers, executives, HR workers, finance management and operations executives.
Through intuitive interfaces, automation and drag-and-drop analytics, modern platforms make it attainable for people who aren't knowledgeable about technology to turn simply collected data into helpful company information.
By embracing self-service BI (business intelligence) companies accelerate decision-making, reduce IT dependency and foster a culture of data literacy. The benefits of self-service analytics for non-technical users are clear: faster reporting cycles, better teamwork, tighter leadership oversight and performance gains that can be measured.
As organizations evaluate the best self-service analytics tools 2026, the focus shouldn't just be on features, but also on training, governing and being able to grow. To implement something successfully, you need clear goals, a structured way to get started, and ongoing help.
For professionals wondering what is self-service analytics and how to use analytics without coding, the answer lies in leveraging intuitive no-code BI platforms, building customized self-service dashboards and adopting modern self-service reporting tools for executives.
In a time when speed and flexibility are what set businesses apart from each other analytics for yourself is no longer optional it is a strategic necessity. By investing in the right low-code analytics solutions and employers set themselves up for accomplishment in a future driven by technology through providing business users simple to operate analytics applications.
Read More: Automated Dashboard for Analytics: Step-by-Step Guide & Tools
More Articles
 30 Apr 2026
How to Avoid Telegram Scams | Warning Signs & Safety Tips
Stop fraudsters in their tracks. Use these 2026 safety tips on how to avoid Telegram scams, spot red flags, and secure your account from hackers.
 29 Apr 2026
How to Use Proxy in Cambodia (Step-by-Step Setup Guide)
Learn how to use proxy in Cambodia with this complete step-by-step guide. Discover setup methods for Android, iPhone, free proxy options, and safety tips for 2026.
 29 Apr 2026
Is Public WiFi Safe to Use? How to Stay Protected
Is public WiFi safe in 2026? Key risks, hacker tactics, and simple ways to protect personal data on public networks.
 29 Apr 2026
How to Build AI Agents Without Coding | No-Code AI Tools
Stop waiting for developers. See how to build AI agents without coding to handle emails, research, and data tasks. Perfect for total beginners.